2008年4月27日 星期日

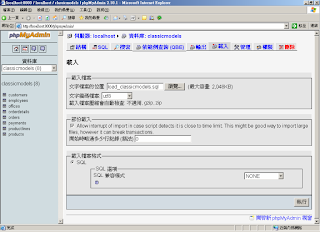
Load Data into MySQL Sample Database

1. Select Database "classicmodels" (Default database name)

2. Load "load_classicmodels.sql" and press execute to load data.

Create MySQL Sample Database

1. Remove comments on the following statements to create database (if first time)

/* Recommended DATABASE name is classicmodels. */

CREATE DATABASE classicmodels;
USE classicmodels;


2. Comments out the following statment (if first time)

/* DROP the existing tables. Comment this out if it is not needed. */

/*
DROP TABLE Customers;
DROP TABLE Employees;
DROP TABLE Offices;
DROP TABLE OrderDetails;
DROP TABLE Orders;
DROP TABLE Payments;
DROP TABLE Products;
DROP TABLE ProductLines;
*/


3. Load "create_classicmodels.sql"into phpMyAdmin and press execute to run SQL.

MYSQL Sample Database

The database consists of eight tables:

* Offices: sales offices
* Employees: All employees, including sales reps.
* Customers
* Orders: Orders placed by customers
* Order Details: Line items within an order.
* Payments: Payments made by customers against their account
* Products: The list of scale model cars
* Product Lines: The list of product line classification

The sample database is open source; you are free to use it for your own use to experiment with other tools.


http://www.eclipse.org/birt/phoenix/db/#mysql
2008年4月26日 星期六

Database 教學

http://db.cse.nsysu.edu.tw/~changyi/slides/db/db2001.html

Source:
http://www.uwants.com/viewthread.php?tid=6112787&extra=page%3D3

2008年4月4日 星期五

Add Chart to PDF Report


' Create Graph pane
Dim w As Integer = 300
Dim h As Integer = 200
Dim myPane As New GraphPane(New Rectangle(0, 0, w, h), "", "", "")

' Set the titles and axis labels
myPane.Title.Text = "My Bar Chart"
myPane.XAxis.Title.Text = "Day"
myPane.YAxis.Title.Text = ""

' Add random data
Dim list As New PointPairList()
Dim rand As New Random()
Dim i As Integer
For i = 0 To 15
Dim x As Double = CDbl(i) + 1
Dim y As Double = rand.NextDouble() * 1000
list.Add(x, y)
Next i

' Create Bar Chart
Dim myCurve As BarItem = myPane.AddBar("", list, Color.Blue)
Dim colors As Color() = {Color.Red, Color.Blue}
myCurve.Bar.Fill = New Fill(colors)
myCurve.Bar.Fill.Type = FillType.Solid
myCurve.Bar.Fill.RangeMin = 0
myCurve.Bar.Fill.RangeMax = 4
myPane.Chart.Fill = New Fill(Color.White, Color.FromArgb(220, 220, 255), 45)
myPane.Fill = New Fill(Color.White, Color.FromArgb(255, 255, 225), 45)

'Create Bitmap
Dim bm As Drawing.Bitmap = New Bitmap(1, 1)
Dim g As Graphics = Graphics.FromImage(bm)
myPane.AxisChange(g)

' Create PDF file
Dim Doc As New iTextSharp.text.Document(iTextSharp.text.PageSize.A4.Rotate())
Dim writer As iTextSharp.text.pdf.PdfWriter
writer = PdfWriter.GetInstance(Doc, New FileStream("Chap0610.pdf", FileMode.Create))

' Open PDF file for write
Doc.Open()
Dim cb As PdfContentByte = writer.DirectContent

' Write Chart/image to PDF file
Dim im As iTextSharp.text.Image
im = iTextSharp.text.Image.GetInstance(myPane.GetImage(), Drawing.Imaging.ImageFormat.Bmp)
im.SetAbsolutePosition(50.0F, 80.0F)
cb.AddImage(im)


' Close PDF document
Doc.Close()
g.Dispose()